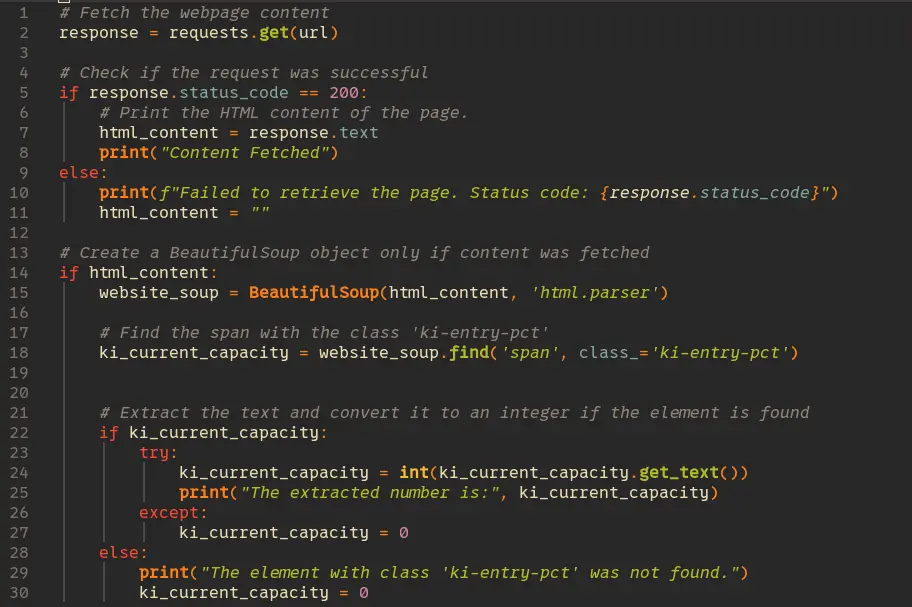
My local climbing gym displays its current capacity in real time on its website. I built a web scraper in Python that parses the page and stores the current capacity in a CSV file. I then automated this script with GitHub Actions to run every 10 minutes.
I also created a Flask app in Python that parses this CSV file, averages the data for each day of the week and returns a JSON export. I Dockerized this codebase and deployed it on Render as an API endpoint, then wrote an HTML page to plot and display the data.
This project taught me a ton about CI/CD deployment and Docker while also telling me the best time to go climbing. The full codebase is on my GitHub, and the data is plotted on my website here in all its 90s-style HTML glory.